 Integrated Annual Report 2014
Menu
 Integrated Annual Report 2014
Menu
Zimplats delivered another solid operational performance with the new Mupfuti continuing to ramp-up successfully. As a result, tonnes milled increased by 27% over the previous year. The increase in production contributed to the cost containment of unit costs, which reduced by 1% in dollar terms.
It is deeply regrettable that a Zimplats employee suffered a fatal injury at the mining operations during the period. Despite this setback, there is a resolute commitment to creating a safe working environment and the implementation of a range of safety initiatives continues to be prioritised.
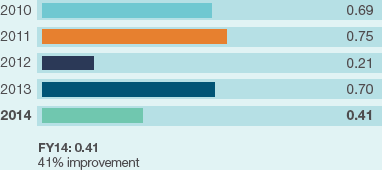
There was an improvement in other safety parameters compared to last year with six (2013: 12) lost-time injuries in the year and a lost-time injury rate of 0.41 (2013: 0.70) per million man-hours worked. The all injury frequency rate was 1.37 per million shifts worked compared to 2.20 per million shifts worked last year.
Skills development again received focused attention at Zimplats. An amount of US$2.5 million (2013: US$2.6 million) was spent on training over the year with 527 employees undergoing a total of 2 105 (2013: 2 661) days of leadership development while apprenticeships and learnerships benefited 39 (2013: 53) employees.
A total of US$1.1 million (2013: US$2.6 million) was invested in communities in the year under review. Zimplats is also focused on various development projects that include the construction of primary and secondary schools, as well as a community clinic where rehabilitation and re-equipping continued over the year.
Housing remains a critical issue for employees at Zimplats and as at year end, Zimplats had 680 core houses and 387 company houses at Turf Village in Ngezi.
Zimplats has achieved its target of directing approximately 60% of annual supplier spend towards local suppliers, which the company believes will support the broader economic recovery of the country. During the year local suppliers accounted for 66% of the company's annual expenditure on goods and services, up from 64% in 2013.
The Community Share Ownership Trust, which forms part of the envisaged indigenisation plan, received US$4.2 million (2013: US$2.5 million) this year. Projects initiated by the trust include the rehabilitation and extension of schools, the drilling of boreholes, purchase of road maintenance equipment and the development of infrastructure to support sustainable income-generating projects.
The programme initiated last year to engage sex workers in the informal settlements surrounding the mine, as part of the HIV/Aids and sexually transmitted disease programmes, continued this year. It has resulted in a 3.7% reduction in the visible incidence of sexually transmitted infections. In addition, the company is continuing to supply employees with antiretroviral medication with 136 (2013: 120) employees receiving treatment.
Large investments continue to be made to mitigate Zimplats' environmental impact. This year US$1 million (2013: US$8 million) was allocated to rehabilitation work. Work continued on preparations for the implementation of an SO2 abatement scrubber which will cost in the region of US$80 million. This year Zimplats accounted for 84% (2013: 65%) of group SO2 emissions due to the ramp-up of the Phase 2 expansion project.
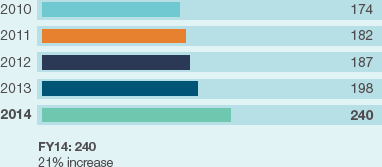
Tonnes milled increased by 27% from the previous year to 5.9 million (2013: 4.7 million) as the Mupfuti mine (Portal 3) started to ramp-up production during the year and due to the planned increase in the mining cut. This resulted in platinum in matte increasing by 21% to 239 700 (2013: 198 100) ounces in line with the ramp-up of the Phase 2 expansion.
| 2014 | 2013 | 2012 | 2011 | 2010 | ||
| Safety leading indicators | ||||||
| Hazards for which internal STOP Notes have been issued | (no) | 1 | 8 | 353 | 1 140 | – |
| Stoppage/instructions issued by State or DMR | (no) | – | 1 | 15 | – | – |
| Leadership STOP Observations | (no) | 30 452 | 22 027 | 18 942 | – | – |
| Safety representative training | (no) | 194 | 74 | 183 | 30 | – |
| Safety lagging indicators | ||||||
| Fatal injury frequency rate | (pmmhw) | 0.068 | 0.000 | 0.000 | 0.000 | 0.000 |
| Lost-time injury frequency rate | (pmmhw) | 0.41 | 0.70 | 0.21 | 0.75 | 0.69 |
| Total injury frequency rate | (pmmhw) | 1.37 | 2.20 | 2.22 | 3.39 | 3.61 |
| Lost days rate | (pmmhw) | 30 | 28 | 11 | 28 | 20 |
| Health | ||||||
| Noise-induced hearing loss cases submitted | (no) | 6 | 2 | – | – | – |
| On wellness programme | (no) | 145 | 135 | 129 | 106 | 68 |
| On anti-retroviral therapy | (no) | 137 | 120 | 114 | 92 | 63 |
| Environmental | ||||||
| Total water consumed | (Mℓ) | 10 386 | 7 852 | 6 003 | 5 528 | 6 172 |
| Total water recycled | (%) | 38 | 26 | 27 | 28 | 23 |
| Total CO2 emissions | ('000tpa) | 364 | 410 | 428 | 417 | 398 |
| Total direct SO2 emissions | (tpa) | 26 000 | 12 017 | 13 470 | 12 100 | 12 449 |
| People | ||||||
| Own employees | (no) | 3 325 | 2 929 | 2 791 | 2 757 | 2 418 |
| Contractors | (no) | 2 749 | 2 775 | 6 412 | 2 610 | 1 262 |
| Literacy (ABET level (III)) | (%) | 99 | 99 | 99 | 99 | 99 |
| Labour turnover | (%) | 4 | 4 | 4 | 4 | 5 |
| Social | ||||||
| Community spend | (Rm) | 10 | 37 | 41 | 9 | 2 |
| Sales | (Rm) | 5 973 | 4 159 | 3 665 | 3 709 | 3 052 |
| Platinum | 3 180 | 2 321 | 2 026 | 2 004 | 1 767 | |
| Palladium | 1 429 | 854 | 674 | 692 | 405 | |
| Rhodium | 208 | 133 | 145 | 211 | 252 | |
| Nickel | 614 | 411 | 410 | 465 | 366 | |
| Other | 542 | 440 | 410 | 337 | 262 | |
| Cost of sales | (Rm) | (3 934) | (2 708) | (2 076) | (1 779) | (1 626) |
| On-mine operations | (1 942) | (1 434) | (1 089) | (870) | (806) | |
| Processing operations | (1 047) | (627) | (494) | (446) | (373) | |
| Selling and administration | (219) | (222) | (212) | (183) | (145) | |
| Share-based payments | (19) | 4 | 17 | (20) | ||
| Depreciation | (645) | (433) | (329) | (239) | (184) | |
| Change in metal inventories | (62) | 4 | 31 | (21) | (118) | |
| Gross profit/(loss) | (Rm) | 2 039 | 1 451 | 1 589 | 1 930 | 1 426 |
| Intercompany adjustment* | (Rm) | (116) | (33) | 43 | (81) | (412) |
| Adjusted gross profit | (Rm) | 1 923 | 1 418 | 1 632 | 1 849 | 1 014 |
| Royalty expense | (Rm) | (423) | (303) | (262) | (113) | (69) |
| Gross margin | (%) | 34.1 | 34.9 | 43.4 | 52.0 | 46.7 |
| Sales volumes in matte | ||||||
| Platinum | ('000oz) | 234.4 | 195.4 | 187.2 | 182.2 | 171.5 |
| Palladium | ('000oz) | 195.0 | 156.2 | 150.5 | 148.9 | 139.8 |
| Rhodium | ('000oz) | 21.6 | 17.8 | 16.7 | 16.3 | 15.1 |
| Nickel | (t) | 4 748 | 3 908 | 3 769 | 3 481 | 3 131 |
| Prices achieved in matte | ||||||
| Platinum | (US$/oz) | 1 308 | 1 347 | 1 398 | 1 564 | 1 364 |
| Palladium | (US$/oz) | 706 | 620 | 578 | 661 | 384 |
| Rhodium | (US$/oz) | 928 | 849 | 1 124 | 1 841 | 2 204 |
| Nickel | (US$/t) | 12 472 | 11 919 | 14 041 | 18 997 | 15 466 |
| Exchange rate achieved | (R/US$) | 10.37 | 8.82 | 7.74 | 7.03 | 7.56 |
| * Adjustment note: The adjustment relates to sales from Zimplats to the Implats Group which at year end were still in the pipeline. |
| 2014 | 2013 | 2012 | 2011 | 2010 | ||
| Production | ||||||
| Tonnes milled ex-mine | ('000t) | 5 939 | 4 683 | 4 393 | 4 223 | 4 095 |
| Headgrade (6E) | (g/t) | 3.47 | 3.53 | 3.53 | 3.56 | 3.56 |
| Platinum in matte | ('000oz) | 239.7 | 198.1 | 187.1 | 182.1 | 173.9 |
| Palladium in matte | ('000oz) | 197.6 | 157.1 | 149.2 | 148.1 | 140.2 |
| Rhodium in matte | ('000oz) | 22.3 | 17.0 | 16.9 | 16.8 | 15.5 |
| Nickel in matte | (t) | 4 830 | 3 909 | 3 787 | 3 519 | 3 105 |
| PGM in matte | ('000oz) | 515.8 | 416.2 | 396.4 | 388.8 | 368.9 |
| Cost | ||||||
| Total cost | (Rm) | 3 208 | 2 283 | 1 795 | 1 499 | 1 324 |
| (US$m) | 309 | 259 | 232 | 213 | 175 | |
| Cost per tonne milled | (R/t) | 540 | 487 | 409 | 355 | 323 |
| (US$/t) | 52 | 55 | 53 | 50 | 43 | |
| Cost per PGM ounce in matte | (R/oz) | 6 219 | 5 485 | 4 528 | 3 855 | 3 589 |
| (US$/t) | 600 | 622 | 585 | 548 | 475 | |
| Cost per platinum ounce in matte | (R/oz) | 13 383 | 11 524 | 9 594 | 8 232 | 7 614 |
| (US$/t) | 1 291 | 1 307 | 1 239 | 1 171 | 1 008 | |
| Cost net of revenue received for other metals | (R/oz) | 1 731 | 2 246 | 834 | (1 131) | 224 |
| (US$/t) | 167 | 255 | 108 | (161) | 30 | |
| Capital expenditure | (Rm) | 1 225 | 1 449 | 2 137 | 840 | 698 |
| (US$m) | 118 | 164 | 276 | 119 | 92 | |
| Labour efficiency | ||||||
| Tonnes milled per employee costed** | (t/man/annum) | 1 339 | 1 159 | 1 128 | 1 166 | 1 317 |
| ** Total employees excluding capital project employees. |
Mining operations at Bimha Mine (Portal 4) were impacted by a shear/fault zone (the Mutambara Shear). To mitigate effects of the Shear, grout pack installation commenced in February 2014 at the expected slow commissioning pace and the installation rate ramped up to full capacity in March 2014. However, post year end there was an acceleration of the deterioration of ground conditions associated with the Shear. Pillar scaling, fracturing and footwall heave were then noted on a regular basis and a full intervention programme was put in place.
Investigations concluded that the conditions over a wide area were no longer safe and a decision was made to barricade and withdraw people and machinery from back areas and mining areas. As a result of the safe withdrawal, there were no injuries or damage to employees or mobile equipment. A team of Company and independent advisers have been appointed to conduct detailed investigations to re-engineer and/or arrest the current mine stability concerns. Consequently, there is a possible production impact of up to 70 000 platinum ounces in 2015.
Overall, the head grade declined by 2% to 3.47g/t (2013: 3.53g/t) due to the planned increase in mining height and bad ground conditions at some of the mines and over-breaks as a consequence of the Mutambara Shear. As a result, concentrator recoveries decreased to 81.7% (2013: 82.7%).
Platinum unit costs benefited from the increased volumes, but were partly offset by inflation of 6.4% (2013: 6.2%), which was driven by increases in power of 58.2% and labour costs of 4.5%. The effective power tariff for Zimplats increased in June 2013 as prepaid power units were exhausted in May 2013. As a result unit costs improved by 1% to US$1 291 (2013: US$1 307) per platinum ounce in matte. The weaker exchange rate impacted rand unit costs, which increased by 16% to R13 383 (2013: R11 524) per platinum ounce in matte.
Capital expenditure for the year declined by 28% to US$118 million (2013: US$164 million) from the previous year as the Phase 2 expansion project nears completion.
| Major capital projects | Phase 2 | |
| Capital spend 2014 | US$64 million | |
| Remaining capital spend | US$73 million | |
| Estimated total capital spend | US$492 million | |
| Full production date | 2015 | |
| Steady-state throughput | 2.0mtpa | |
| Steady-state platinum production | 90kozpa | |
| Remaining activities | Development of Mupfuti mine to reach design capacity |
The company committed to a first stage refurbishment of the existing Selous-based base metals refinery (BMR) to partially treat Zimplats' material during the year. The total project cost for the BMR refurbishment is estimated at approximately U$100 million, and project implementation is scheduled to start in July 2014 with an estimated 24 months completion period.
A full rock engineering back-analysis process is underway to better understand the impact of the Mutambara Shear at Bimha mine and once completed a new set of mitigation measures will be communicated and implemented.
Development of the Mupfuti Mine (Portal 3) remains on schedule to reach design capacity in early calendar year 2015. This will conclude the Phase 2 Expansion Project.
Management continues to engage actively with the Government of Zimbabwe in respect of the indigenisation implementation plan, corporate taxation, royalty dispensation and the company's commitment to primary beneficiation within Zimbabwe.
