
Annual Integrated Report for the year ended 30 June 2024
Annual Integrated Report for the year ended 30 June 2024

MEROONISHA KERBER, CHIEF FINANCIAL OFFICER
Implats experienced a substantial drop in PGM prices in FY2024, influenced by industrial and automotive destocking, as well as negative investor sentiment amid a complex macro-economic landscape. This decline affected profitability and cash generation materially, necessitating a set of strategic responses to ensure long-term sustainability

The balance sheet is strong, with adequate cash reserves and appropriate funding flexibility to pursue our strategic objectives while still providing for operational flexibility amid significant market volatility.
Despite strong operational delivery in FY2024 and disciplined cost control, the year was characterised by significantly weaker US dollar sales revenue. Sharply lower average palladium and rhodium pricing negated higher sales volumes and the benefit of a weaker average rand. Several once-off cash and non-cash items also negatively impacted the Group’s reported earnings.
Capital expenditure was keenly interrogated given the constrained PGM pricing environment, with the project portfolio focused on meeting the Group’s value-focused strategy and long-term ambitions. In addition, the Group commenced, and post-year-end, concluded a restructuring process to manage costs and optimise labour deployment across the corporate and operational functions.
STRATEGIC FOCUS |
  |
Implats’ strategically pursues meaningful value creation for all stakeholders, including providing attractive returns to shareholders, while maintaining the financial flexibility for the Group.
The Group’s balance sheet remains strong, and together with undrawn committed facilities, Implats has sufficient headroom for liquidity requirements and to withstand prevailing market volatility to deliver on its strategy (refer to our business model and value proposition from page 31).
During the period, Implats incurred R8.2 billion on stay-in-business and replacement capital, with a further R0.4 billion spent on acquiring shares for the Implats share incentive schemes. After adjusting for foreign exchange translation losses of R0.9 billion, the Group realised an adjusted free cash outflow of R0.5 billion (FY2023: inflow of R16.6 billion), pre-growth capital.
No final dividend was declared, in line with the Group’s dividend policy, premised on returning a minimum of 30% of adjusted free cash flow, pre-growth capital.
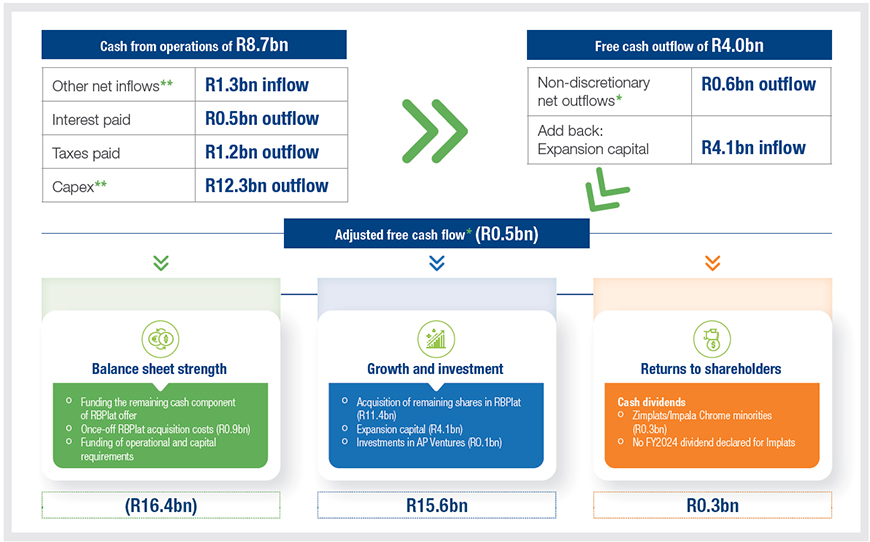
| * | Free cash flow adjusted for outflows/impacts relating to expansion capital and foreign exchange transaction adjustment on cash and cost of purchasing shares for the Implats share scheme. |
| ** | Includes the movement in prepayments related to capital, representing cash capital expenditure. |
Due to the negative free cash generation during the period, cash reserves of R16.4 billion were used to support the remaining cash component of the RBPlat mandatory offer and fund the once-off RBPlat acquisition costs, as well as the Group’s operational and capital requirements.
In FY2024, R15.6 billion in cash was allocated to growth and investment by funding the R11.4 billion cash consideration for the remaining RBPlat equity, investment of R4.1 billion in strategic expansion projects at the Group’s mining and processing operations and contributing to AP Ventures.
Free cash flow allocated to shareholder returns, through dividends to Zimplats and Impala Chrome minorities, accounted for R0.3 billion.
KEY RISKS |
||||
Key financial risks |
|
Risk management and risk governance is achieved by allocating risks to all relevant Group governance structures (refer to Corporate governance delivering value on page 62 and Managing performance through remuneration on page 65). The Group has exposure to several risks, including those associated with financial, credit, liquidity, currency, fair value, cash flow, interest rate and pricing market risks, as well as cyber security, which is allocated to the CFO (refer to our operating context on page 26 and risk section on page 39).
Implats’ formal financial risk management framework actively manages, monitors and reports on risk mitigation measures and compliance with Company policy (refer to the financial risk management in note 34 of the consolidated financial statements for the year ended 30 June 2024). Current macro-economic conditions impact spot PGM basket prices, which at the levels prevailing during FY2024, together with elevated levels of capital expenditure, put most operations’ free cash flow at break-even or negative. The Group conducts ongoing break-even analysis, monitors PGM prices and analyses market demand and its potential impact on the PGM basket price (refer to our operating context on page 26).
Price response strategies consider various pricing scenarios and include capital rationalisation or deferment and cost-saving measures across all operations. Overall level of profitability and free cash generation also impact decarbonisation projects, the ability to contribute to social programmes. It also resulted in a formal Section 189 process, which was concluded at the South African operations subsequent to year-end. The Group continues to promote demand for PGMs and develop a wider understanding of these markets.
Currency or exchange rate induced inflation and instability remain key risks at the Group. Following the conversion of historical Zimbabwe dollar (ZWL) through introduction of the new currency, Zimbabwe Gold (ZWG), exchange rate inflation on prices of local goods and services will be mitigated through implementation of initiatives that seek to provide certainty and predictability on operating costs management.
There was an increase in cyber attacks globally and on southern African mining companies. The nature of cyber threats is evolving, requiring Implats to continually assess the effectiveness of its cyber security control environment. Cyber-risk assessments are executed alongside risk mitigation processes, to ensure proactive risk identification and to enhance of existing controls against the emerging cyber trends and attack vectors.
Our chief information officer reports to the Group’s chief financial officer and provides the ARC with quarterly updates and in-depth insights into information and communications technology (ICT) governance, cyber security developments and trends, and measures to strengthen Implats’ ICT and cyber security posture, reduce risks and protect the Group’s assets and reputation from cyber threats. He also provides feedback on the integration of IT and operational technologies (OT) and the work being done to improve OT security and controls.
To test the effectiveness of existing cyber security controls and identify gaps and areas for improvement, the Group conducts continuous ethical hacking and penetration scenarios, scheduled and ad hoc scans, and monitors and manages third-party software and operating systems vulnerabilities. Focus areas include user account access security, extending intrusion and vulnerability detection software, and implementing data loss prevention (DLP) solutions.
Sustainability risks |
|
Employees, governments and mine-host communities are key stakeholders, and central to the Group retaining its legal and social licence to operate. Labour and royalties comprise a significant proportion of Implats’ cost base. We recognise the link between tax and sustainability and acknowledge that an increasing number of stakeholders view our tax contributions as a key measure of our licence to operate. Implats contributes economic value to governments and host communities in South Africa, Zimbabwe and Canada, and pays taxes and royalties through the lifecycle of operations and across its value chain. The Group’s total tax contribution of R10.2 billion (FY2023: R15.6 billion) and value-added statement are disclosed in our stakeholder interests and outcomes on page 47.
In the current year, Implats concluded a series of landmark agreements, paving the way to implement a meaningful B-BBEE transaction at both its Impala and Impala Bafokeng assets that resulted in an associated IFRS 2 charge of R1.9 billion. The transaction resulted in 13% B-BBEE ownership at Impala (including Impala Rustenburg, Refineries and IRS) and Impala Bafokeng. Equity ownership is through an employee share ownership trust (ESOT), a community share ownership trust (CSOT) and a strategic empowerment consortium, with holdings of 4%, 4% and 5%, respectively. Additionally, Zimplats’ Empowerment Plan was approved by the Zimbabwean government in 2022, after which Zimplats issued equity in its empowerment companies to a CSOT. Future dividends from these companies are committed to ensuring that communities realise tangible benefits from their equity ownership.
Organisational and operational legal and compliance management functions ensure ongoing engagement with the DMR, compliance with approved SLP project requirements, water and emissions licences, regulations and legislation. Sustainable, safe and environmentally sensitive production are key to operational delivery and are closely monitored and managed across various leading and lagging indicators and KPIs.
To address the Group’s energy security needs and to meet its decarbonisation goals, Implats completed a US$37 million, 35MW solar PV plant at Zimplats, the first of such scale at Implats and the largest utility-scale solar plant in Zimbabwe. Capital has been allocated toward the second 45MW phase of Zimplats’ solar project. Renewable energy offtake agreements from energy aggregators in South Africa were assessed as a lever to accelerate our electricity supply transition towards renewable sources and further contribute to the Group’s decarbonisation ambitions.
The Group’s R1.1 billion investment in AP Ventures provides access to investment opportunities in global technologies and start-ups that promote the use of PGMs in the hydrogen economy, with the potential to adopt these technologies in our operations in the future (refer to our climate change report for additional information).
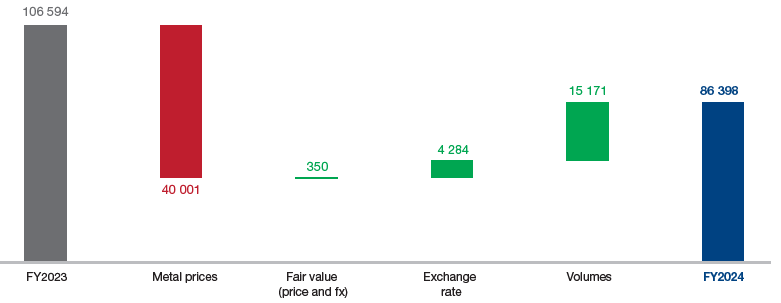
Revenue of R86.4 billion was 19%, or R20.2 billion lower than the prior year:
FY2025 outlook
Refined volumes will benefit from the partial release of previously accumulated excess inventory, with Group sales expected to be in line with refined and saleable production.
| Metals sold during the year | Unit | FY2024 | FY2023 | % change |
| Sales volumes achieved | ||||
| 6E | 000oz | 3 438.6 | 2 973.0 | 15.7 |
| Platinum | 000oz | 1 579.4 | 1 408.1 | 12.2 |
| Palladium | 000oz | 1 192.9 | 1 047.4 | 13.9 |
| Rhodium | 000oz | 193.3 | 167.8 | 15.2 |
| Nickel | tonnes | 12 617 | 10 902 | 15.7 |
| Average prices achieved | ||||
| Platinum | US$/oz | 934 | 962 | (2.9) |
| Palladium | US$/oz | 1 083 | 1 763 | (38.6) |
| Rhodium | US$/oz | 4 360 | 11 696 | (62.7) |
| Nickel | US$/t | 18 241 | 23 864 | (23.6) |
| Average rate achieved | R/US$ | 18.71 | 17.75 | 5.4 |
| Revenue per 6E ounce sold | US$/oz | 1 350 | 2 035 | (33.7) |
| Revenue per 6E ounce sold | R/oz | 25 257 | 36 118 | (30.1) |
Revenue (Rm)
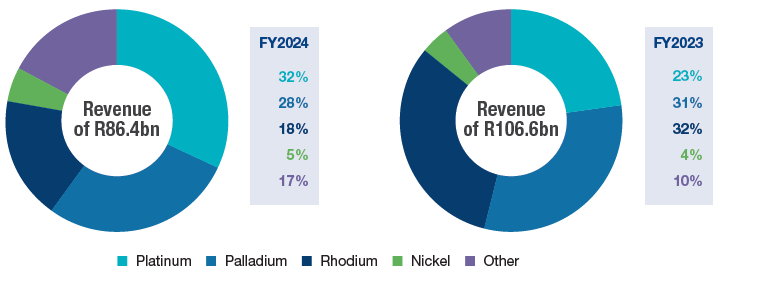
Revenue by metal (%)
Cost of sales decreased by 4% or R3.3 billion to R80.9 billion:
The credit to the cost of sales arising from the movement in metal inventories increased to R1.9 billion from a debit of R2.5 billion in the prior year, which was the result of the write-down of rhodium to net realisable value in that period. The impact of higher in-process inventory and unit costs in the current year was partially offset by a reduction in refined inventory.
Excess process inventory |
|
The Group ended the year with excess in-process inventory of approximately 390 000 6E ounces (FY2023: 245 000 6E ounces) due to processing capacity being limited by the scheduled rebuild of the Number 5 furnace at Impala Rustenburg.
The estimated financial valuation of the excess in-process inventory, using the average rand basket price achieved, is R9.8 billion in revenue, R3.5 billion gross profit and R7.1 billion in cash flow (net of taxes and royalties), which is expected to be realised over the next three years as the excess in-process inventory is released.
The Group manages lower stages of load curtailment by reducing power to its furnaces and concentrators, while mining and hoisting volumes are only impacted at higher stages. These mitigating actions result in a combination of ‘foregone’ and ‘deferred’ production volumes.
Mining and processing performance benefited from reduced load curtailment in South Africa, but Zimbabwe experienced heightened electricity supply constraints. As a result, Implats estimates production of circa 21 000 6E ounces was foregone (FY2023: 36 000 6E ounces) across southern African managed and JV operations during the year, while a further 12 000 6E ounces were deferred (FY2023: 101 000 6E ounces).
FY2025 outlook
Considering the annual maintenance schedule and the year-end stock take at the refineries during the first quarter of FY2025, the excess in-process inventory is expected to reduce to circa 260 000 6E ounces by 30 June 2025. Group processing capacity will benefit from higher annual available capacity at Impala Rustenburg and will be bolstered by the commissioning of the new furnace at Zimplats in H1 FY2025. This will facilitate the steady release of excess inventory over the FY2025, FY2026 and FY2027 reporting periods.
| FY2024 | FY2023 | % change |
|
| On-mine operations | 41 291 | 32 476 | (27.1) |
|---|---|---|---|
| Processing operations | 12 887 | 10 437 | (23.5) |
| Refining and selling | 2 480 | 2 537 | 2.2 |
| Corporate costs | 1 892 | 2 052 | 7.8 |
| Cash costs | 58 550 | 47 502 | (23.3) |
| Depreciation of operating assets | 8 044 | 7 736 | (4.0) |
| Metals purchased | 13 534 | 22 253 | 39.2 |
| (Increase)/decrease in metal inventories | (1 850) | 2 546 | 172.7 |
| Royalty expenses | 1 750 | 2 624 | 33.3 |
| Other | 903 | 1 595 | 43.4 |
| Cost of sales | 80 931 | 84 256 | 3.9 |
Cost of sales (Rm)

FY2025 outlook
Implats remains focused on delivering safe and profitable production – planning and capital investment are structured to enhance the competitive positioning of each asset, maximise returns and limit the use of the balance sheet to cross-subsidise loss-making operations.
Stock-adjusted unit costs* increased by 5% or R1 088 per 6E ounce to R20 922:
Normalised unit costs, excluding the consolidation of Impala Bafokeng and the impact of the prior year’s discretionary bonus, increased by 3% to R20 041 per 6E ounce. The stock-adjusted unit costs were below the FY2024 guidance range.
* Refer to the key statistics and additional notes on page 110 of the FY2024 segmental information report for the full definition of stock-adjusted unit costs.
Stock-adjusted unit costs (R/oz 6E)

FY2025 outlook
| Unit | FY2024 | Outlook FY2025 |
|
| Refined production | 6E koz | 3 378 | 3 450 – 3 6501 |
|---|---|---|---|
| Group production | 6E koz | 3 654 | 3 500 – 3 700 |
| Group stock-adjusted unit costs | R/oz 6E | 20 922 | 21 000 – 22 000 |
| Exchange rate assumptions | R/US$ | 18.71 | 18.25 |
| C$/US$ | 1.35 | 1.33 |
1 Includes Impala Canada and Impala Bafokeng saleable ounces.
Group unit costs are forecast to rise by up to 5% to be between R21 000 and R22 000 per ounce on a stock-adjusted basis.
Group production in FY2025 will be supported by sustained operating momentum at Impala Rustenburg, Zimplats and Mimosa and a stabilising performance at Two Rivers. Third-party receipts are expected to reflect the volumes from pre-existing contracts.
The Group generated a gross profit of R5.5 billion (FY2023: R22.3 billion) at a gross profit margin of 6% (FY2023: 21%).
Implats accounted for several significant once-off, non-cash items in profit before tax during the year:
Income was impacted by foreign exchange losses of R0.9 billion (FY2023: R0.9 billion gains). Other net expenses included the R1.9 billion non-cash IFRS 2 B-BBEE charge, R418 million transaction-related costs associated with concluding the RBPlat acquisition and R488 million incurred on the labour restructuring processes at Impala Canada, Zimplats, the South African managed operations and the corporate office in the period. The impact of lower PGM pricing on earnings at both JVs, Two Rivers and Mimosa, was compounded by the combined post-tax impairments of R1.7 billion, resulting in a loss from associates of R1.2 billion (FY2023: profit of R3.4 billion, benefiting from RBPlat equity earnings).
The tax credit for the year amounted to R3.3 billion (FY2023: R3.6 billion charge) resulting in an effective tax rate of 16% (FY2023: 37%). The tax rate was impacted by adjustments for non-deductible expenditure related to the impairments and the IFRS 2 B-BBEE charge, and the post-tax accounting of the losses from associates while benefiting from a deferred tax credit of R1.5 billion relating to the reversal of withholding tax on undistributed profits at Zimplats, partially offset by a R0.3 billion charge due to a change in the corporate tax rate in Zimbabwe.
| FY2024 Rm |
FY2023 Rm |
||
| Revenue | 86 398 | 106 594 | |
|---|---|---|---|
| Cost of sales | (80 931) | (84 256) | |
| Gross profit | 5 467 | 22 338 | |
| Impairment – Property, plant and equipment | (12 258) | (10 872) | |
| Impairment – Goodwill | (6 347) | (4 244) | |
| Impairment – Prepaid royalty | (3 247) | — | |
| IFRS 2 charge on B-BBEE transaction | (1 932) | — | |
| Loss on remeasurement of previously held equity investment before acquisition – RBPlat | — | (1 772) | |
| Other net expenses | (119) | (1 079) | |
| Net finance income | 116 | 1 177 | |
| Net foreign exchange transaction (losses)/gains | (924) | 857 | |
| Share of (loss)/profit of equity-accounted entities | (1 182) | 3 382 | |
| (Loss)/profit before tax | (20 426) | 9 787 | |
| Income tax credit/(expense) | 3 275 | (3 609) | |
| (Loss)/profit for the year | (17 151) | 6 178 | |
| Gross profit margin | % | 6 | 21 |
| EBITDA | 12 367 | 36 002 | |
| Headline earnings | 2 411 | 18 801 | |
| Group unit costs (stock-adjusted) | R/oz 6E | 20 922 | 19 834 |
The Group recorded an EBITDA of R12.4 billion (FY2023: R36.0 billion) at an EBITDA margin of 14% (FY2023: 34%), negatively impacted by the once-off non-cash IFRS 2 B-BBEE charge and expenses associated with the RBPlat acquisition and labour restructuring.
Headline earnings of R2.4 billion or 269 cents per share were 87% and 88% lower than the prior year, respectively, and reflect the 215 cents per share impact of the IFRS 2 B-BBEE charge (FY2023: R18.8 billion and 2 211 cents per share).
Basic earnings declined to a loss of R17.3 billion or 1 929 cents per share, from basic earnings of R4.9 billion or 577 cents per share in the prior year. The cumulative impact of impairments, including Implats’ attributable share of the impairments at the JVs in FY2024, resulted in a post-tax charge of R19.8 billion or 2 204 cents per share.
The weighted average number of shares in issue increased to 897.36 million from 850.28 million in the prior year. The total issued capital increased to 904.37 million shares as at 30 June 2024 (FY2023: 866.40 million), after 37.97 million Implats shares with a fair value of R5.2 billion were issued as part of the acquisition consideration for RBPlat.
Headline earnings (Rm)
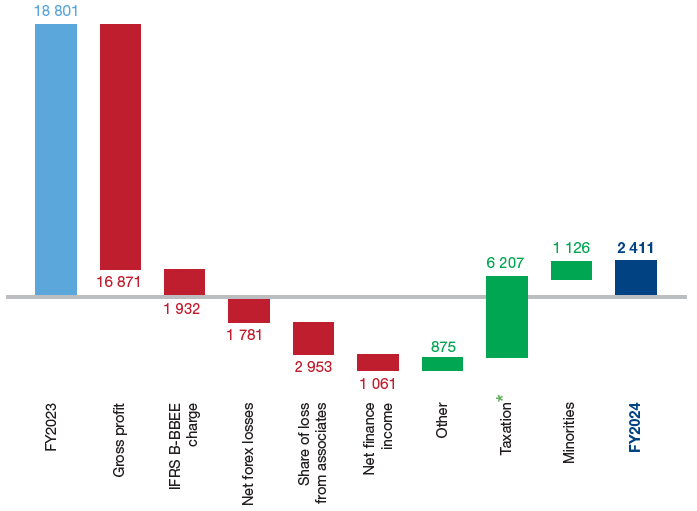
* Includes the tax effects of the headline earnings adjustments.
Implats sustained a strong and flexible balance sheet position, despite several challenges and a constrained operating environment.
Lower PGM pricing profiles and changes to life-of-mine resulted in the R21.9 billion impairments of property, plant and equipment, goodwill and prepaid royalties and the R1.7 billion post-tax attributable share of the impairments of the equity-accounted entities.
Prepayments on capital equipment and operating activities at Zimplats, included in other current assets, reduced by R2.2 billion with R1.7 billion transferred to capital expenditure during the year.
Following the acquisition of the remaining RBPlat shares from the minorities, the R5.7 billion non-controlling interest recognised during FY2023 was transferred to equity. The R10.9 billion difference between the adjustment to the minorities and the fair value of the consideration paid was directly recognised in equity attributable to the owners of the Company.
Total liabilities decreased due to the impact of the impairments on deferred tax and lower trade payables relating to metal purchases, driven by the conclusion of two contracts in the prior year, as well as lower metal prices. This was partially offset by Zimplats utilising its R1.1 billion (US$60 million) revolving borrowing base facility.
| FY2024 Rm |
FY2023 Rm |
|
| ASSETS | ||
| Property, plant and equipment | 63 502 | 71 176 |
| Goodwill | 3 523 | 9 870 |
| Investments in equity-accounted entities | 10 305 | 12 525 |
| Other non-current assets | 5 038 | 8 053 |
| Non-current assets | 82 368 | 101 624 |
| Inventories | 26 578 | 24 320 |
| Trade and other receivables | 11 826 | 11 310 |
| Other current assets | 2 554 | 5 312 |
| Cash and cash equivalents | 9 629 | 26 820 |
| Current assets | 50 587 | 67 762 |
| Total assets | 132 955 | 169 386 |
| EQUITY | ||
| Equity attributed to owners of the Company | 91 399 | 114 847 |
| Non-controlling interests | 5 226 | 11 188 |
| Total equity | 96 625 | 126 035 |
| LIABILITIES | ||
| Deferred tax | 13 332 | 19 140 |
| Deferred revenue | 1 259 | 1 238 |
| Borrowings | 1 912 | 2 255 |
| Other non-current liabilities | 2 983 | 3 046 |
| Non-current liabilities | 19 486 | 25 679 |
| Trade and other payables | 14 798 | 16 041 |
| Borrowings | 1 429 | 335 |
| Other current liabilities | 617 | 1 296 |
| Current liabilities | 16 844 | 17 672 |
| Total equity and liabilities | 132 955 | 169 386 |
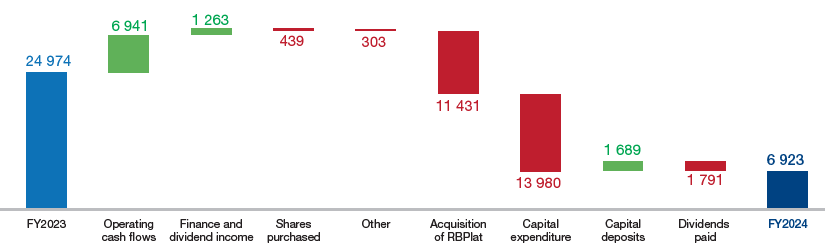
Cash flows from operating activities decreased by 71% to R8.7 billion from R30.4 billion. The impact of materially lower received rand PGM pricing was compounded by the working capital impact of higher in-process inventory, a timing delay in the R1.0 billion receipt for the sale of concentrates at Impala Bafokeng, which was received in early July 2024, and R0.9 billion on once-off RBPlat transaction costs in FY2024. Net cash inflows from operating activities of R6.9 billion declined from R23.6 billion in the prior year.
Net capital cash outflows decreased by 3% to R12.3 billion (FY2023: R12.7 billion). A further R1.7 billion of capital payments, primarily associated with the Zimplats growth projects and incurred in the prior year, was transferred from prepayments to capital expenditure during the year. As a result, the Group’s total capital expenditure increased to R14.0 billion from R11.4 billion, reflecting the consolidation of capital expenditure from Impala Bafokeng (R1.4 billion), higher levels of growth capital at Zimplats and the impact of rand depreciation on the translation of foreign subsidiaries’ spend. Stay-in-business spend increased by 10% to R8.1 billion, while replacement spend of R1.8 billion decreased by 19% and expansion capital of R4.1 billion increased by 114%.
The Group recorded a free cash outflow of R4.0 billion (FY2023: inflow of R14.2 billion).
The cash consideration associated with acquiring the remaining shareholding in RBPlat resulted in a R11.4 billion outflow (FY2023: R4.9 billion) during the year. Implats received R0.2 billion (FY2023: R1.6 billion) in dividends from its JVs and associates.
Dividend payments totalling R1.8 billion (FY2023: R13.6 billion) were made to shareholders (R1.5 billion) and non-controlling interests at Zimplats and Impala Chrome (R0.3 billion).
The Group ended the year with cash and cash equivalents of R9.6 billion (FY2023: R26.8 billion). Zimplats used its revolving borrowing base facility of R1.1 billion (US$60 million) to fund its elevated capital expenditure during the year. The consolidation of Impala Bafokeng’s PIC housing facility of R1.4 billion and deferred revenue of R1.5 billion associated with its gold streaming facility resulted in gross debt of R4.0 billion (FY2023: R2.9 billion). Due to limited recourse to Implats, the PIC housing facility has been excluded from debt calculations for the purpose of covenants, resulting in a closing adjusted debt of R2.6 billion and closing adjusted net cash of R6.9 billion (FY2023: R25.0 billion).
At the end of the period, the Group had an undrawn, dual-tranche revolving credit facility (RCF) of R6.5 billion and US$93.8 million, resulting in liquidity headroom of R17.7 billion at 30 June 2024 (FY2023: R37.0 billion). Subsequent to year-end, the undrawn R2.0 billion revolving credit facility and R1.0 billion general banking facility of Impala Bafokeng were cancelled and the RCF was amended and restated to include Impala Bafokeng as an additional guarantor. Further, the accordion option to the R6.5 billion tranche of the RCF was increased by R2.0 billion to R4.2 billion. The accordion option on the US$93.8 million tranche of US$37.5 million remains in place. The RCF matures on 24 February 2026 and Implats intends to refinance the facility ahead of its maturity date.
Adjusted net cash (Rm)
| FY2024 Rm |
FY2023 Rm |
|
| ADJUSTED NET CASH (EXCLUDING LEASES) | ||
| South African cash | 7 354 | 21 119 |
| Offshore cash | 2 275 | 5 701 |
| Gross cash | 9 629 | 26 820 |
| Long-term borrowings | (1 341) | (1 425) |
| Short-term borrowings | (1 147) | (48) |
| Deferred revenue | (1 499) | (1 382) |
| Gross debt (excluding leases) | (3 987) | (2 855) |
| Net cash (excluding leases) | 5 642 | 23 965 |
| Add back PIC loan | 1 396 | 1 473 |
| Deduct restricted cash | (115) | (464) |
| Adjusted net cash | 6 923 | 24 974 |
FY2025 outlook
Implats invested significantly over the past five years in a series of mine replacement, growth, environmental and processing projects to strengthen the competitiveness of its portfolio. For the year ahead, there is an intensified focus on managing capital across all operating subsidiaries in the short term, while preserving operational efficiency through ore reserve positioning, infrastructure integrity and statutory compliance.
The Group capital expenditure is forecast to be between R8.0 billion and R9.0 billion, inclusive of growth capital of between R0.9 billion and R1.1 billion.
| Unit | FY2024 | Outlook FY2025 |
|
| Group capital expenditure | Rm | 14 003 | 8 000 – 9 000 |
|---|---|---|---|
| Exchange rate assumptions | R/US$ | 18.71 | 18.25 |
| C$/US$ | 1.35 | 1.33 |
Impact of our environmental goals on enterprise value

The Group remains committed to the UN SDGs and its environmental goals. Implats’ rehabilitation investment philosophy remains well on track to, over time, result in fully funded retirement obligations at the end of life-of-mine. These investments increased to R2.8 billion (FY2023: R2.5 billion) due to an additional R22 million investment, fair value gains of R231 million and R18 million in interest earned during the year. Guarantees issued to the regulators in respect of environmental rehabilitation liabilities increased to R3.8 billion (FY2023: R3.6 billion). The provision for environmental rehabilitation remained at R2.7 billion due to a net R84 million increase from the ongoing rehabilitation expenditure incurred, annual revisions of estimates and inflation.
A key renewable energy project was delivered and the Group’s commitment to its decarbonisation targets and efforts to combat climate change remain unchanged, despite the constrained operating environment. Refer to the chief operating officer’s review on page 94 for more details on these projects.
There were no subsequent events which materially impact the annual financial statements, aside from the amendments to the credit facilities, mentioned above.
I express my sincere appreciation to Implats’ finance teams for their exceptional effort and dedication in supporting the business during this challenging and constrained operational period, while maintaining high standards of governance, compliance and financial reporting.
Meroonisha Kerber
Chief financial officer